Appearance
写了一个案例:geo-demo
简单gis地图开发
参考文章:使用Echarts制作地图
简单尝试gis地图开发,实现效果如下
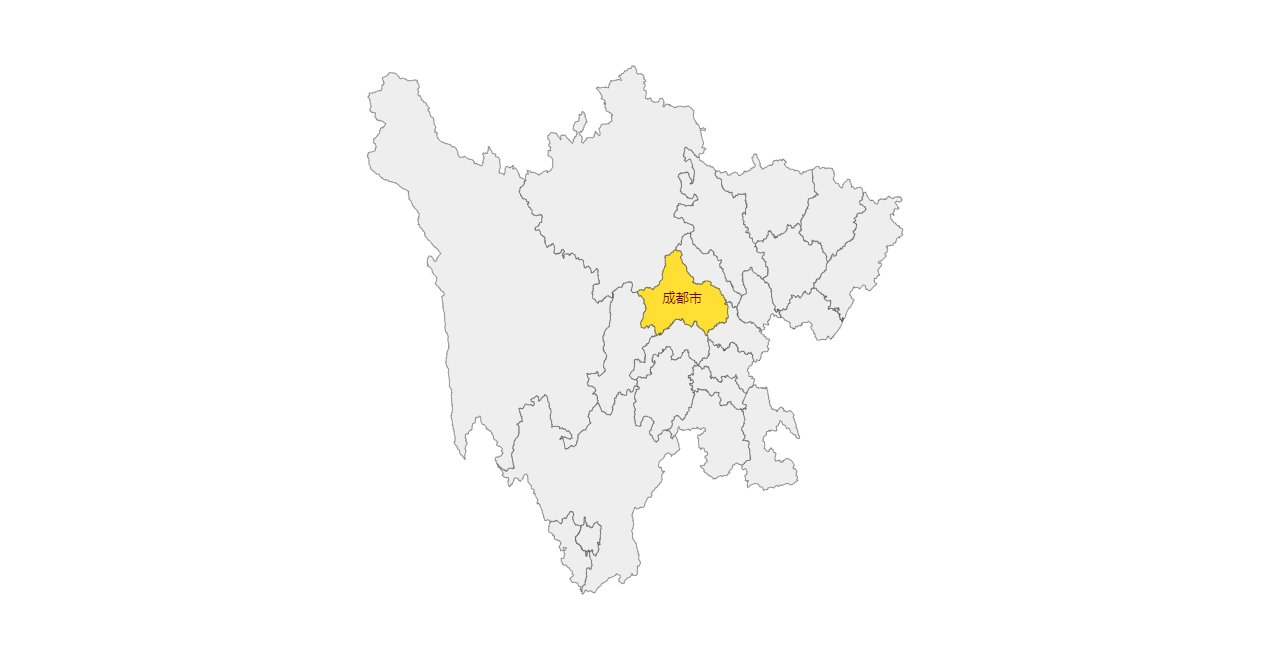
这个交互的地图采用echarts绘制,echarts配置项中的geo传入geoJSON数据
geoJSON可以从开放平台进行编辑和下载,可以在阿里云数据可视化平台进行编辑和下载,具体使用方式可以参考这个平台提供的文档。
也可以使用其他工具,反正最终是需要一个geoJSON文件
echarts先注册这个地图文件,然后在geo中配置:
vue
<script setup>
import * as echarts from "echarts";
import { ref, onMounted } from "vue";
import geoJSON from "@assets/SC";

const chartEl = ref(null);
const chartInstance = ref(null);
onMounted(() => {
    chartInstance.value = echarts.init(chartEl.value);
    echarts.registerMap("SC", { geoJSON });
    chartInstance.value.setOption({
        tooltip: {},
        geo: {
            show: true,
            map: "SC",
        },
    });
});
</script>

<template>
    <div class="app-container">
        <div class="geo-container" ref="chartEl"></div>
    </div>
</template>

<style scoped>
.app-container {
    width: 100%;
}
.geo-container {
    width: 100%;
    height: 600px;
}
</style><script setup>
import * as echarts from "echarts";
import { ref, onMounted } from "vue";
import geoJSON from "@assets/SC";
const chartEl = ref(null);
const chartInstance = ref(null);
onMounted(() => {
chartInstance.value = echarts.init(chartEl.value);
echarts.registerMap("SC", { geoJSON });
chartInstance.value.setOption({
tooltip: {},
geo: {
show: true,
map: "SC",
},
});
});
</script>
<template>
<div class="app-container">
<div class="geo-container" ref="chartEl"></div>
</div>
</template>
<style scoped>
.app-container {
width: 100%;
}
.geo-container {
width: 100%;
height: 600px;
}
</style>geoJSON文件结构
参考文章:GeoJSON三分钟入门教程 geoJSON一共有7种几何形状,分别为:
- Point:点
- MultiPoint:多个点
- LineString:连线
- MultiLineString 多个连线
- Polygon 多边形(必须要闭合)
- MultiPolygon 多个多边形
- GeometryCollection 其余图形的组合
geoJSON 还有两个表示现实含义的类型Feature、FeatureCollection
总共,有以上9种type